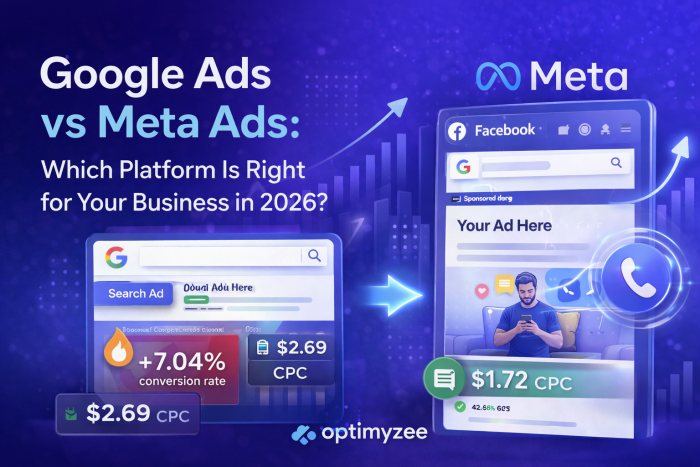
Google Ads captures existing demand – people who are already searching for what you sell. Meta Ads creates demand – it puts your product in front of people who don’t know they want it yet. Google delivers higher average conversion rates (7.04% on Search); Meta delivers lower CPCs ($1.72 average vs $2.69 on Google Search). The answer for most businesses in 2026 is not one or the other – it is understanding which platform plays which role in your specific funnel, and allocating budget accordingly.
“Should I use Google Ads or Meta Ads?” is one of the most common questions business owners and marketing managers ask when planning their paid advertising budget. It is also one of the most misleading questions, because it implies the two platforms are alternatives competing for the same job.
They are not. Google and Meta operate on fundamentally different principles, reach users at different points in the buying journey, and produce different types of outcomes. Understanding that distinction – rather than chasing a single “best platform” answer – is what separates advertisers who get consistent returns from those who switch back and forth wondering why nothing works.
This guide breaks down the core differences between the two platforms in 2026, the performance data across key metrics, how different business types should think about allocation, and when running both together produces better results than either alone.
The Fundamental Difference: Intent vs Discovery
This is the most important concept in the entire comparison, and getting it right frames every budget and strategy decision that follows.
Google Ads captures intent. When someone types “emergency plumber near me” or “best accounting software for small business” into Google, they have already decided they need something. They are actively looking. Your ad appears at the moment of maximum purchase readiness. This is what makes Google Search one of the highest-converting advertising channels in digital marketing – the user’s intent is baked in before your ad appears.
Meta Ads creates demand. Nobody opens Instagram to search for a new product. They are scrolling, watching Reels, checking in with people. Meta’s job – and its genuine strength – is interrupting that scroll with something compelling enough that a person who had no prior purchase intent becomes interested. This is discovery advertising, and it is the mechanism behind product launches, brand building, and reaching audiences who don’t yet know your product exists.
📌 The practical implication: if there is no active search volume for what you sell, Google Search cannot help you. If your product requires visual demonstration or emotional engagement to resonate, Meta will outperform a text-based search ad. Most businesses need both – they just need them at different stages.
Platform Scale and Reach in 2026
Both platforms operate at a scale that is difficult to fully appreciate:
| Metric | Meta | |
| Daily searches processed | 8.5 billion (Google, 2026) | – |
| Monthly active users | – | 3.07 billion (Meta, 2026) |
| Global digital ad market share | ~39% (industry estimates) | ~18% (second largest) |
| Q4 2025 ad revenue | $82.3 billion (Alphabet SEC filing) | Part of $150–170B projected 2026 full-year |
| Ad revenue growth (YoY) | +13.5% Q4 2025 | +21% Q2 2025 |
Both platforms are growing, which means CPC inflation is real on both. Google CPC has risen for 87% of industries year-over-year in 2025–2026 (BrightBid/MetricNexus, 2026). Meta CPM increased 18.3% year-over-year from 2024 to 2025 (MHI Media, 2026). Neither platform is getting cheaper – which makes strategic allocation and creative quality more important than ever.
Sources: Alphabet Q4 2025 SEC filing (February 2026), Meta Q4 2025 investor report, MHI Media ‘Meta Ads Benchmarks for Ecommerce 2026’, BrightBid/MetricNexus 2026 Google Ads benchmarks
Performance Benchmarks: Cost, CTR, and Conversion Rates
| Metric | Google Ads (Search) | Meta Ads |
| Average CPC | $2.69 (all industries) | $1.72 (all industries) |
| Average CTR | 3.17%–6.11% (Search, varies by position) | 0.90% (all placements, all industries) |
| Average conversion rate | 7.04% (Search) | 9.21% (click-to-conversion, all industries) |
| Average CPA | $48.96 (Search) | $18.68 (all industries) |
| Average ROAS (e-commerce) | Varies widely by vertical | 4.52x with Advantage+ Shopping (Meta data, 2025) |
| CPM (cost per 1,000 impressions) | Varies by format | $16.80 average e-commerce (2025) |
⚠️ Raw benchmark comparisons are misleading without context. A $18.68 average CPA on Meta versus $48.96 on Google Search does not mean Meta is 2.5x more efficient – it reflects the different user intent at each touchpoint. A Meta conversion from someone in discovery mode often has lower purchase intent and requires more nurturing than a Google Search conversion from someone who was already looking to buy.
The metrics that matter most depend on your goal. If you need immediate conversions from high-intent traffic, Google Search’s 7%+ conversion rate is unmatched. If you need cost-efficient reach and brand building at scale, Meta’s lower CPM and CPC make it a stronger choice for top-of-funnel investment.
Sources: BrightBid/MetricNexus Google Ads benchmarks 2026, AdAmigo.ai ‘Meta Ads Benchmarks 2026 by Objective and Placement’, SQ Magazine ‘Facebook Ad Statistics 2026’
Targeting: How Each Platform Finds Your Audience
Google Ads Targeting
Google targets based on what people are actively doing – their search queries, the content they consume on YouTube, their browsing history across millions of partner websites, and their declared interests through Google account data.
Primary targeting mechanisms:
- Keyword targeting – ads match specific search queries
- In-market audiences – users currently researching purchase decisions in your category
- Customer Match – upload your CRM data to reach existing customers and find similar users
- Performance Max – AI automatically finds converting users across all Google inventory based on your conversion data
Google’s advantage is data depth: search query intent + YouTube behavior + Gmail signals + Maps data creates a uniquely precise picture of where someone is in a buying journey right now.
Meta Ads Targeting
Meta targets based on who people are – their demographics, interests, behaviours, and connections – and increasingly, on AI predictions of who is most likely to convert based on your conversion data.
Primary targeting mechanisms:
- Core Audiences – demographics, interests, behaviours, life events
- Custom Audiences – your own CRM data, website visitors via Pixel, app activity
- Lookalike Audiences – AI-generated groups resembling your best customers
- Advantage+ Audience – fully AI-driven, treating your inputs as suggestions and expanding to find converting users across the full platform
After Apple’s iOS 14.5 changes in 2021 significantly limited Meta’s third-party tracking capability, the platform rebuilt its targeting around first-party data and on-platform signals. Meta’s Andromeda AI architecture now predicts conversion likelihood for every impression using behaviour signals across Facebook, Instagram, Messenger, and external websites via the Pixel.
💡 Meta’s targeting in 2026 is less about who you think your audience is and more about supplying the algorithm with the right conversion signals so it can find them. Advertisers who try to replicate the granular interest-stacking of 2018-era Facebook targeting are fighting against the platform’s direction.
Which Platform Works Best by Business Type
Local Service Businesses (plumbers, dentists, lawyers, cleaning services)
Primary recommendation: Google Ads (Search + LSA). When someone needs a plumber, they search. The intent is immediate and high – they are not browsing Instagram wondering if they need a plumber. Google Search and Local Service Ads (which show directly in search results with verification badges) are purpose-built for this. Meta can support local service businesses for brand awareness and retargeting, but it is a secondary channel.
E-commerce
Primary recommendation: Both, with distinct roles. The most successful U.S. e-commerce brands in 2026 typically allocate around 60% of paid budget to Google and 40% to Meta (TechEmpires, 2026). Google Shopping and Performance Max capture buyers with purchase intent. Meta Advantage+ Shopping and Reels ads drive product discovery and reach new audiences who have never heard of the brand. Neither works as well alone as they do together.
B2B and Professional Services
Primary recommendation: Google Ads (Search). B2B buyers research solutions on Google. The search queries are specific, the intent is clear, and the conversion path is more direct than social media. Meta can work for B2B – particularly for awareness and retargeting decision-makers on Facebook – but the quality of traffic differs. B2B advertisers on Meta typically see longer conversion cycles and lower immediate conversion rates, requiring stronger remarketing infrastructure.
New Product Launches and Brand Awareness
Primary recommendation: Meta Ads. If there is no existing search volume for your product – because it is genuinely new, or because the problem it solves has not yet been articulated as a search query – Google cannot help. Meta’s discovery-based model is built for creating awareness from scratch. Reach new audiences with Reels, demonstrate the product with carousel and video formats, build interest before the Google search ever happens.
High-consideration B2C Purchases (real estate, luxury goods, finance)
Primary recommendation: Both at different funnel stages. These purchases involve long consideration cycles. Meta builds awareness and emotional connection. Google captures buyers who have entered the active research phase. Remarketing across both platforms – showing Google Search ads to people who engaged with Meta campaigns – is particularly effective for high-ticket categories.
Source: TechEmpires ‘Meta Ads vs Google Ads – Which Delivers Better Results To USA Businesses?’ (February 2026)
The Case for Running Both: Full-Funnel Thinking
The most important finding from cross-platform research is consistent: businesses that run Google Ads and Meta Ads together outperform those running either platform alone.
A hybrid funnel approach – using Meta for awareness and Google for conversion capture – typically delivers 2.5x higher ROI than single-platform campaigns, according to Spinta Digital’s 2026 analysis of cross-platform campaigns.
The mechanism is what digital marketers call the halo effect: Meta Ads build brand awareness and generate interest; when those same users later search on Google, branded search volume increases. Your Google Ads capture that intent at a lower CPC than cold acquisition, because the user already has positive brand awareness from the Meta touchpoint.
A practical full-funnel structure:
- Top of funnel (Meta): Reels and video ads introducing your brand to cold audiences. Goal: awareness and engagement.
- Mid-funnel (Meta retargeting): Testimonial and comparison content for people who engaged with top-funnel ads. Goal: consideration.
- Bottom of funnel (Google): Search and Shopping ads capturing users who are now actively searching. Goal: conversion.
- Cross-platform retargeting: Google Display and YouTube remarketing for users who visited your site from Meta but didn’t convert – and vice versa.
💡 The sequencing insight: run Meta to create awareness, then capture with Google when they search. The most cost-efficient acquisition strategy in 2026 combines both platforms deliberately, with each handling the stage where it has structural advantage.
How to Allocate Your Budget
There is no universal ratio, but these guidelines provide a sensible starting point based on business type and stage:
| Business Type | Suggested Allocation | Notes |
| Local service (plumber, dentist, etc.) | 80% Google / 20% Meta | Google Search + LSA primary; Meta for brand and retargeting |
| E-commerce (established) | 60% Google / 40% Meta | Google Shopping + PMax; Meta Advantage+ Shopping for discovery |
| E-commerce (launching new product) | 40% Google / 60% Meta | Meta builds awareness first; scale Google as search volume grows |
| B2B lead generation | 70% Google / 30% Meta | Google Search primary; Meta for decision-maker retargeting |
| Brand awareness campaign | 30% Google / 70% Meta | Meta’s CPM is more efficient for reach at scale |
| High-consideration B2C | 50% Google / 50% Meta | Both platforms at different funnel stages |
⚠️ These ratios are starting points for testing, not permanent rules. Run both platforms for 30–60 days, measure CPA and ROAS for each, and reallocate budget toward whichever is driving the most efficient outcomes for your specific business. The data from your own campaigns is always more reliable than any benchmark.
FAQ
Which platform has a lower cost per click – Google or Meta?
Meta Ads generally have a lower average CPC – $1.72 across all industries versus $2.69 for Google Search ads (2026 benchmarks). However, lower CPC does not mean more cost-efficient. Google Search traffic converts at a higher rate (7.04% average) because users are actively searching with purchase intent. Meta’s lower CPC reflects a lower-intent audience that typically requires more nurturing before converting. Compare cost per acquisition, not cost per click, when evaluating efficiency.
I have a limited budget – should I start with Google or Meta?
If your business has active search volume – meaning people are already typing queries related to what you sell – start with Google Search. You are capturing existing demand at the moment of highest intent, and the conversion path is shorter. If your product or service has minimal search volume, or if you need to build brand awareness before purchase consideration is realistic, start with Meta. A practical rule: if you don’t know which applies to your business, run a small test on both – $250–500 per platform over 30 days – and let the data guide allocation.
Can I run Google Ads and Meta Ads with the same creative?
Not effectively. Google Search ads are text-based and need to match search queries precisely. Meta ads are visual-first and need to interrupt a scroll with a compelling image or video within 3 seconds. The platforms require different creative strategies. What you can align is messaging – your unique selling proposition, key benefits, and offers should be consistent across both platforms, even if the format and creative execution differ significantly.
Which platform is better for generating leads?
It depends on your industry and lead quality requirements. Google Ads delivers higher-intent leads – people who searched for your solution are already in the consideration phase. Meta delivers higher volume at lower cost per lead, but typically requires more qualification work. For B2B with high deal values, Google Search usually wins on lead quality. For B2C service businesses with high lead volume needs, Meta can deliver at scale. Many businesses use both: Meta for top-of-funnel lead volume, Google for capturing the highest-intent prospects.
Does advertising on Meta improve Google Ads performance?
Yes – this is the halo effect. Meta campaigns build brand awareness; when those same users later search on Google, branded search volume increases. Branded search queries typically convert at higher rates and lower CPCs than non-branded queries because the user already has positive brand familiarity. This is one of the primary arguments for running both platforms simultaneously rather than choosing between them. Measuring the uplift requires tracking branded vs non-branded search performance as Meta spend scales.
The Bottom Line
Google Ads and Meta Ads are not competitors for the same advertising job. They are complementary tools that operate at different stages of the customer journey. Google is the most effective tool ever built for capturing demand at the moment of intent. Meta is the most effective tool at scale for building that demand in the first place.
The question is not which platform is better – it is which platform is better for which stage of your customer’s journey, and how much of your budget should go to each based on your specific business model, competitive environment, and growth goals.
For most established businesses, the highest-ROI strategy in 2026 is not picking a winner. It is running both platforms deliberately, with a clear understanding of the role each plays, proper cross-platform tracking to measure the full journey, and regular budget reallocation based on actual performance data.
→ Already running Google Ads campaigns and looking to maximise their performance before adding Meta to the mix? Optimyzee analyses your campaign structure, keyword organisation, and search term data to ensure your Google Ads foundation is solid before you scale.
Sources
Alphabet Inc.: Q4 2025 / FY2025 SEC filing (February 2026) – Google ad revenue $82.3B Q4, +13.5% YoY
BrightBid / MetricNexus: Google Ads benchmarks 2026 – avg CPC $2.69, CTR 3.17–6.11%, conversion rate 7.04%
AdAmigo.ai: ‘Meta Ads Benchmarks 2026 by Objective and Placement’ – avg CPC $1.72, CVR 9.21%, CPA $18.68
MHI Growth Engine: ‘Meta Ads Benchmarks for Ecommerce 2026’ (February 2026) – CPM +18.3% YoY, ASC 62% of spend
SQ Magazine: ‘Facebook Ad Statistics 2026‘ – 82% of Meta advertisers use Advantage+ automation
TechEmpires: ‘Meta Ads vs Google Ads – Which Delivers Better Results To USA Businesses?’ (February 2026)
Spinta Digital: ‘Google Ads vs Meta Ads 2026’ – 2.5x ROI with hybrid funnel approach (January 2026)
Lemonade Digital: ‘Google Ads vs Meta Ads: Key Differences, ROI & Which Is Best’ (January 2026)